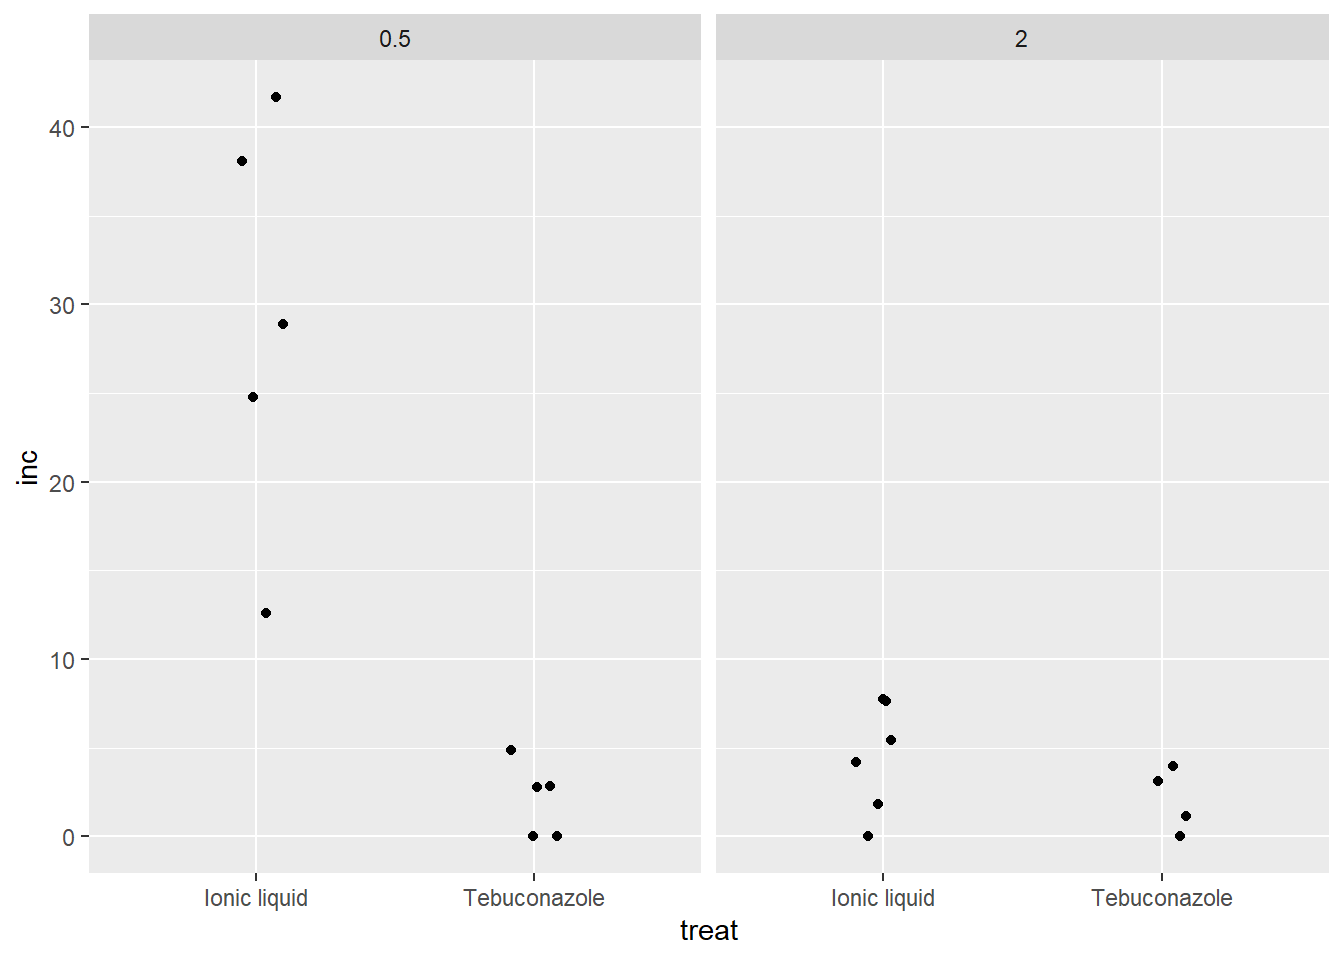
m1<-aov(log(inc+0.5)~treat*dose,
        data=m1)
summary(m1)
            Df Sum Sq Mean Sq F value  Pr(>F)
treat        1 12.928  12.928  13.980 0.00179 **
dose         1  5.663   5.663   6.124 0.02491 *
treat:dose   1  5.668   5.668   6.129 0.02486 *
Residuals   16 14.796   0.925
---
Signif. codes:  0 '***' 0.001 '**' 0.01 '*' 0.05 '.' 0.1 ' ' 1
Warning: package 'performance' was built under R version 4.2.3
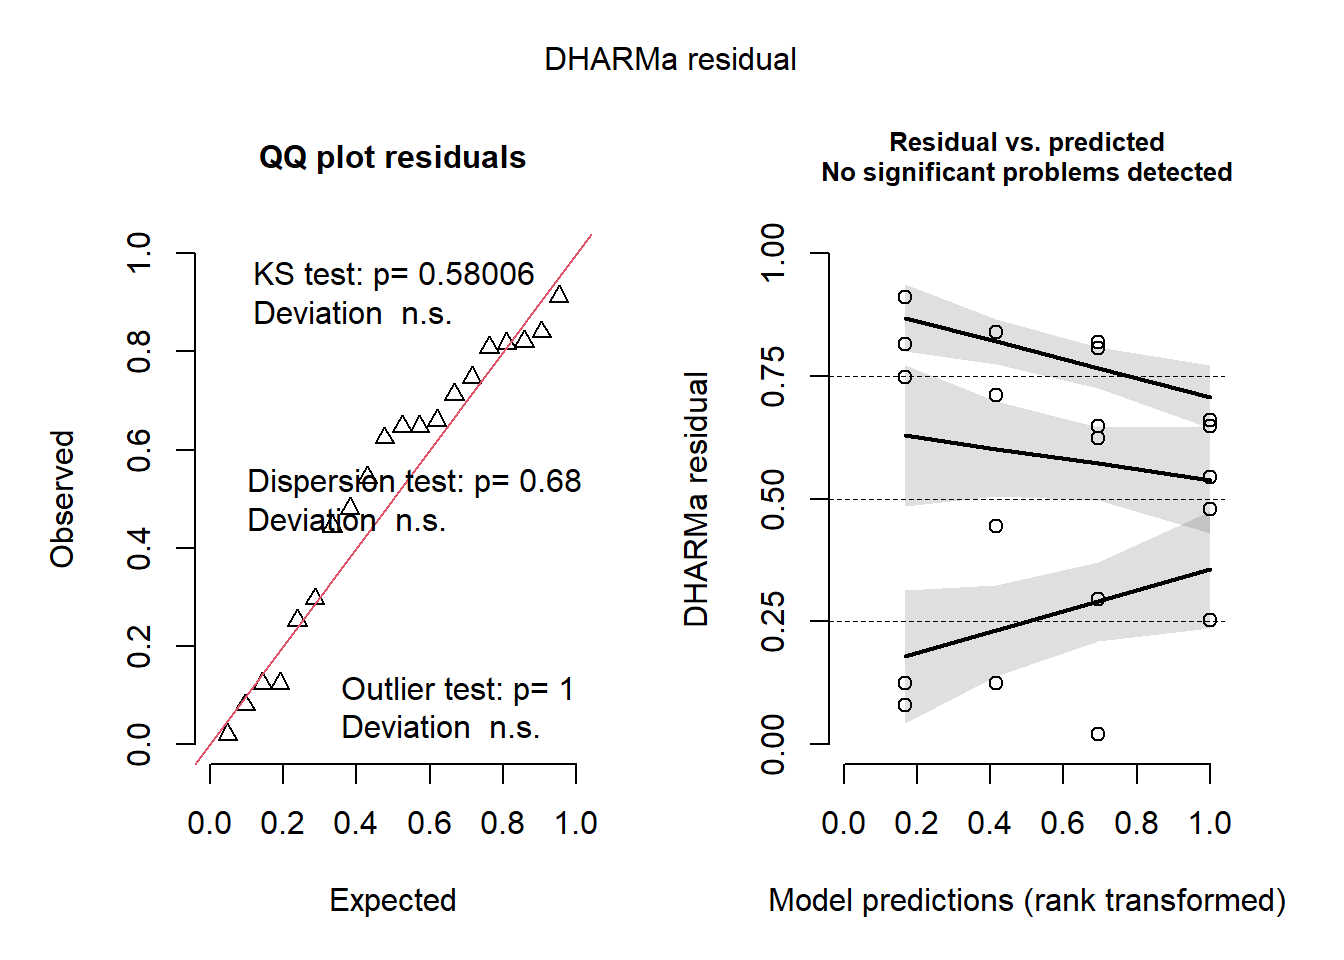
Warning: Non-normality of residuals detected (p = 0.050).
check_heteroscedasticity(m1)
OK: Error variance appears to be homoscedastic (p = 0.180).
This is DHARMa 0.4.6. For overview type '?DHARMa'. For recent changes, type news(package = 'DHARMa')
plot(simulateResiduals(m1))
Warning in checkModel(fittedModel): DHARMa: fittedModel not in class of
supported models. Absolutely no guarantee that this will work!
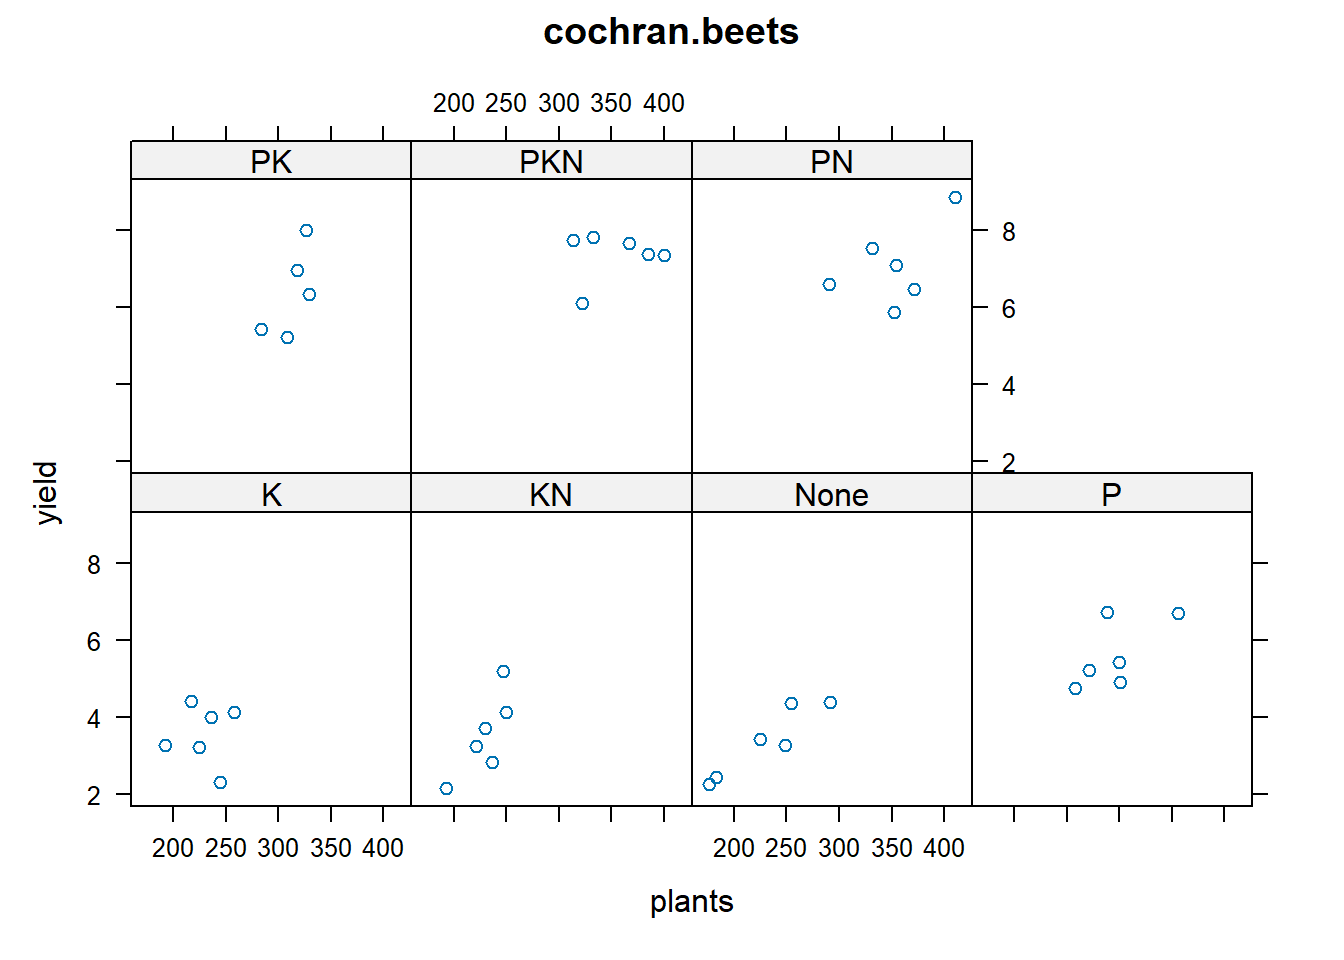
library(agridat)
data(cochran.beets)
dat = cochran.beets

# P has strong effect
libs(lattice)
Warning: package 'lattice' was built under R version 4.2.3
xyplot(yield ~ plants|fert, dat, main="cochran.beets")