library(readxl)
library(tidyverse)
Warning: package 'ggplot2' was built under R version 4.2.3
Warning: package 'tibble' was built under R version 4.2.3
Warning: package 'dplyr' was built under R version 4.2.3
── Attaching core tidyverse packages ──────────────────────── tidyverse 2.0.0 ──
✔ dplyr     1.1.2     ✔ readr     2.1.4
✔ forcats   1.0.0     ✔ stringr   1.5.0
✔ ggplot2   3.4.2     ✔ tibble    3.2.1
✔ lubridate 1.9.2     ✔ tidyr     1.3.0
✔ purrr     1.0.1
── Conflicts ────────────────────────────────────────── tidyverse_conflicts() ──
✖ dplyr::filter() masks stats::filter()
✖ dplyr::lag()    masks stats::lag()
ℹ Use the conflicted package (<http://conflicted.r-lib.org/>) to force all conflicts to become errors
estande <- read_excel("dados-diversos.xlsx", "estande")
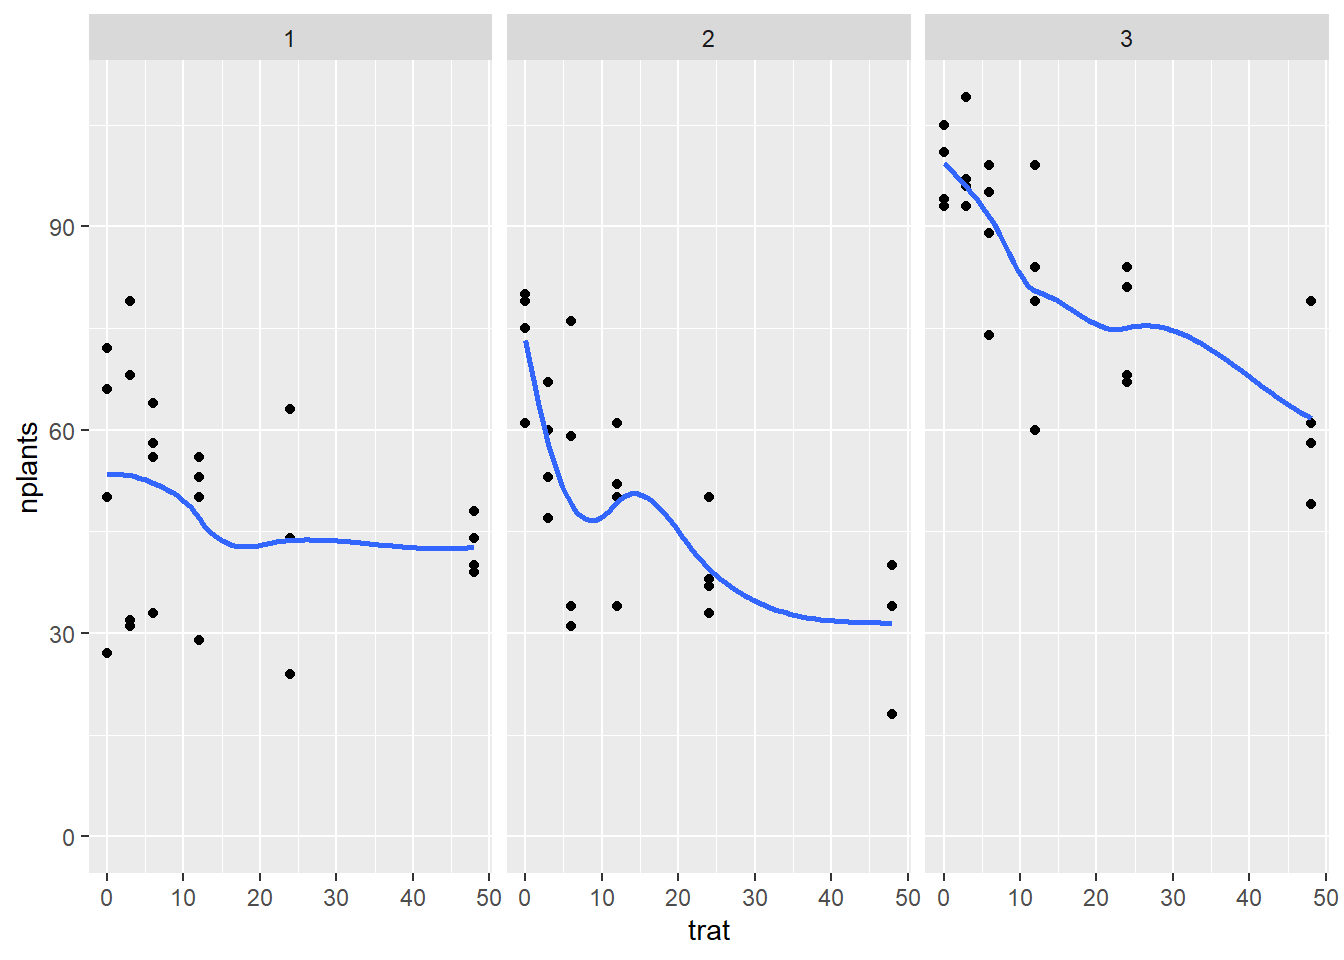
estande |>
ggplot(aes(trat, nplants, group = exp))+
geom_point()+
facet_wrap(~exp)+
ylim(0,max(estande$nplants))+
geom_smooth(se = F)
`geom_smooth()` using method = 'loess' and formula = 'y ~ x'
Warning: package 'ggtext' was built under R version 4.2.3
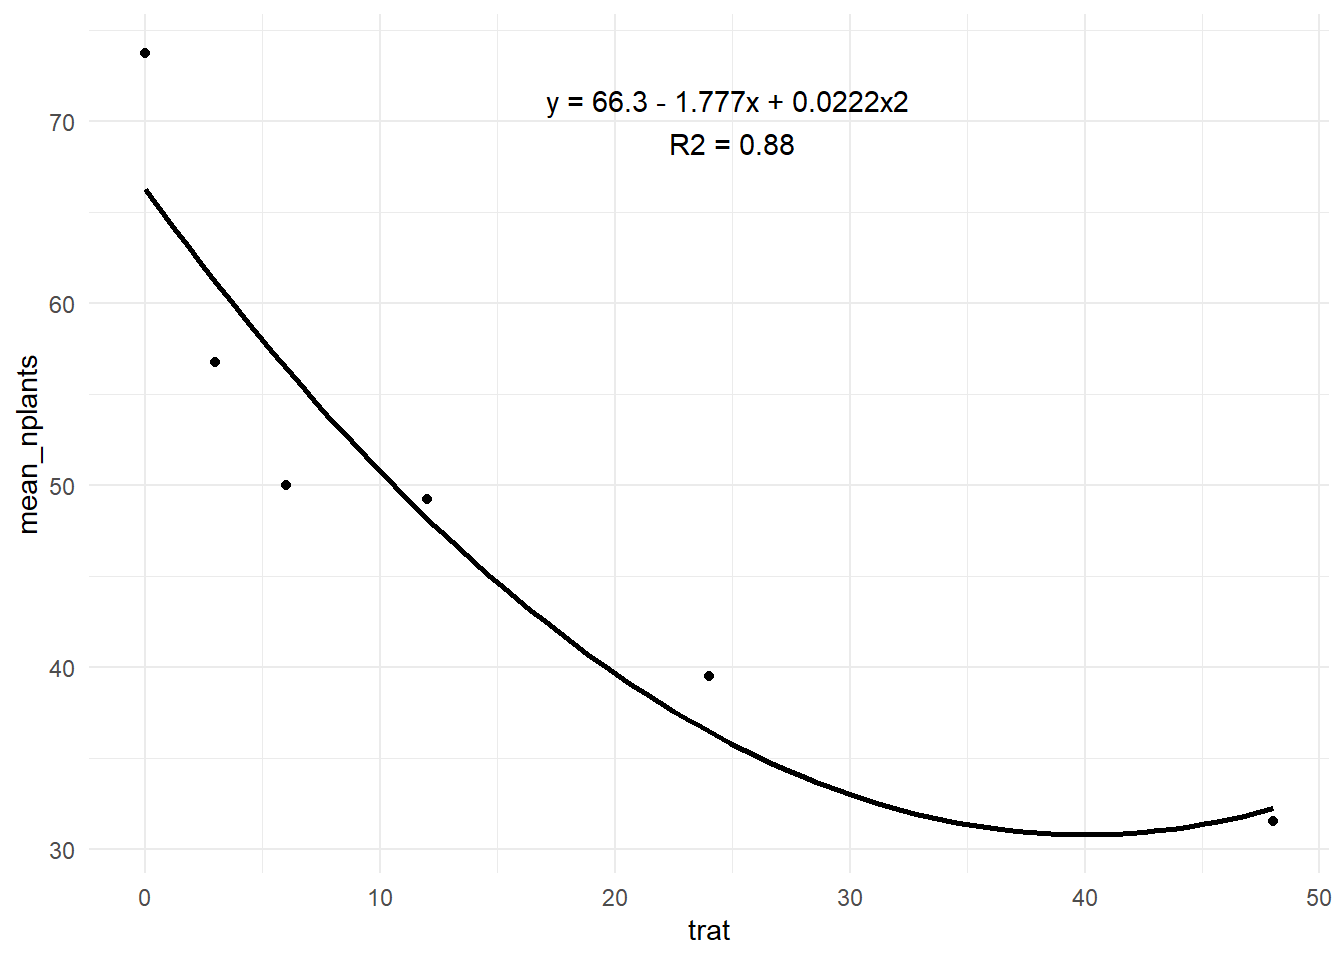
estande2 <- estande |>
  filter(exp == 2)|>
  group_by(trat) |>
  summarise(mean_nplants = mean(nplants))

estande2 |>
  ggplot(aes(trat, mean_nplants))+
  geom_point()+
  #geom_line()+
  geom_smooth(se = F, formula = y ~ poly(x, 2), method = "lm", color = "black")+
  theme_minimal()+
  annotate(geom = "text",
           x = 25, y = 70,
           label = "y = 66.3 - 1.777x + 0.0222x2
R2 = 0.88")
estande2 <- estande2 |>
mutate(trat2 = trat^2)
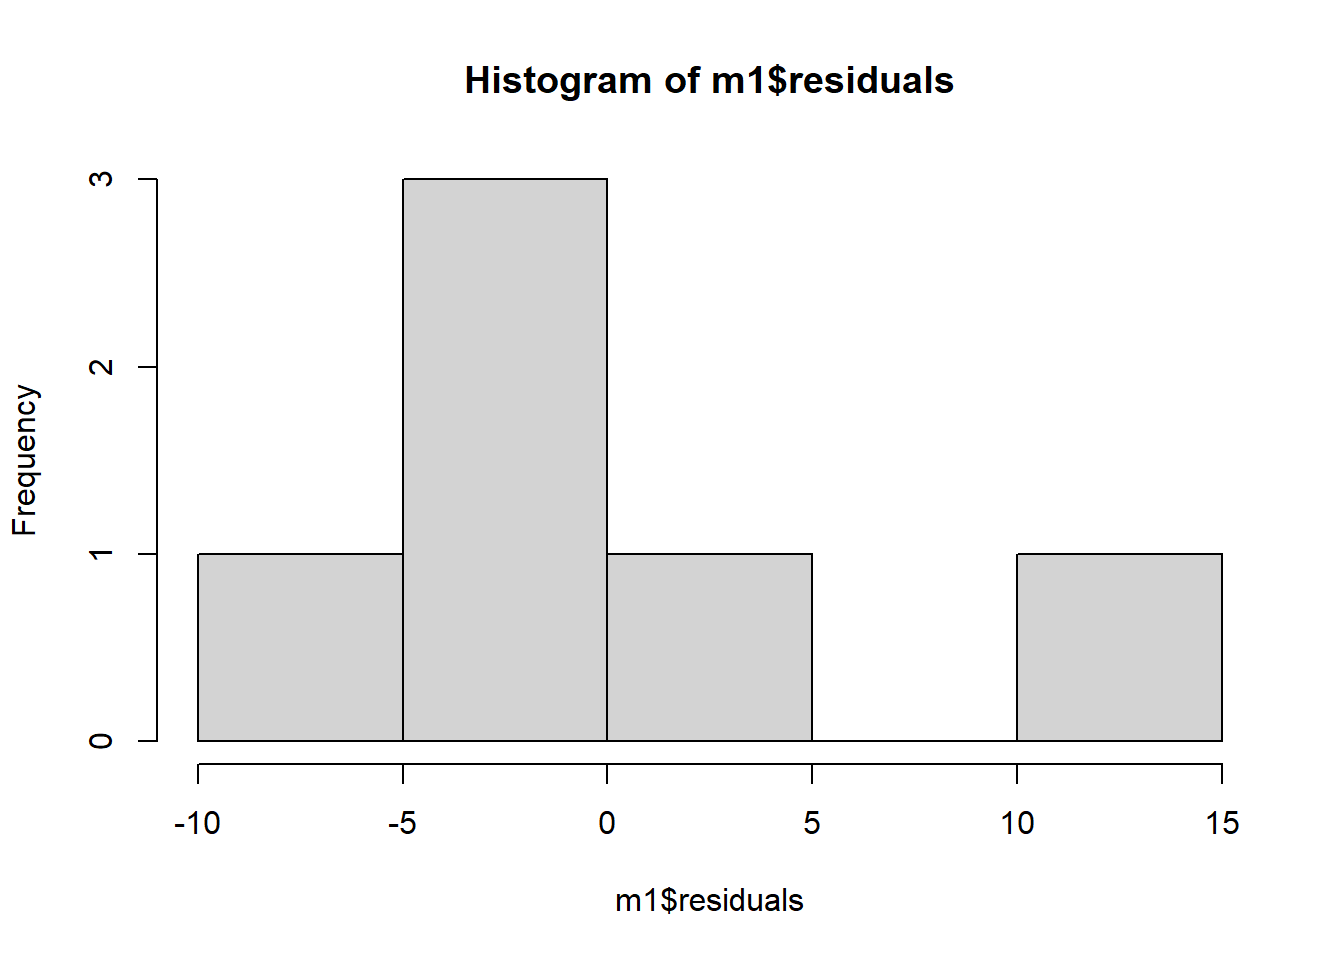
m1 <- lm(mean_nplants ~ trat,
data = estande2)
summary(m1)
Call:
lm(formula = mean_nplants ~ trat, data = estande2)

Residuals:
     1      2      3      4      5      6
12.764 -2.134 -6.782 -3.327 -4.669  4.147

Coefficients:
            Estimate Std. Error t value Pr(>|t|)
(Intercept)  60.9857     4.5505  13.402 0.000179 ***
trat         -0.7007     0.2012  -3.483 0.025294 *
---
Signif. codes:  0 '***' 0.001 '**' 0.01 '*' 0.05 '.' 0.1 ' ' 1

Residual standard error: 8.117 on 4 degrees of freedom
Multiple R-squared:  0.752, Adjusted R-squared:   0.69
F-statistic: 12.13 on 1 and 4 DF,  p-value: 0.02529
m2 <- lm(mean_nplants ~ trat + trat2,
         data = estande2)
summary(m2)
Call:
lm(formula = mean_nplants ~ trat + trat2, data = estande2)

Residuals:
      1       2       3       4       5       6
 7.4484 -4.4200 -6.4386  1.0739  3.0474 -0.7111

Coefficients:
            Estimate Std. Error t value Pr(>|t|)
(Intercept) 66.30156    4.70800  14.083 0.000776 ***
trat        -1.77720    0.62263  -2.854 0.064878 .
trat2        0.02223    0.01242   1.790 0.171344
---
Signif. codes:  0 '***' 0.001 '**' 0.01 '*' 0.05 '.' 0.1 ' ' 1

Residual standard error: 6.517 on 3 degrees of freedom
Multiple R-squared:  0.8801,    Adjusted R-squared:  0.8001
F-statistic: 11.01 on 2 and 3 DF,  p-value: 0.04152
   df      AIC
m1  3 45.72200
m2  4 43.36151